ARTICLE
From Thin to Deep:
Mapping Urban Music through Multimedia Web Apps
Martin Nicastro
Sound Stage Screen, Vol. 3, Issue 2 (Fall 2023), pp. 77–105, ISSN 2784-8949. This work is licensed under a Creative Commons Attribution-ShareAlike 4.0 International License. © 2024 Martin Nicastro. DOI: https://doi.org/10.54103/sss22317.
In the last few years, geospatial data analysis and visualization tools are progressively spreading across music studies. After an experimental phase, which we could identify in the work carried out by Sara Cohen on Liverpool, [1] we are witnessing a systematic use of Geographic Information Systems (GIS) in projects of greater and greater scope. Their employment both in a historical context [2] and for the investigation of contemporary live music ecosystems [3] testifies to the adaptability of these tools to different research needs, while the persistence of the urban perspective seems to demonstrate a particular effectiveness in a distinct branch of studies. In fact, GIS enables researchers to carry out wide-ranging readings of complex spatial phenomena thereby broadening the scope of urban music research. This potential does not come without methodological risks, however, some of which appear to be specific to the object of study.
This article stems from a discussion of these risks, in the belief that the tension between humanistic disciplines and digital tools should be, first and foremost, a constructive one. At the heart of what we define today as Digital Humanities lies a vision of reciprocity, [4] the conception of a circular and recursive relationship between research and technology. On one hand, the possibilities offered by new tools should lead to new ways of analyzing the sources, to new research questions and to new methodologies. [5] On the other, humanistic perspectives can and should contribute to the formation of technology. While less frequent, this second interaction appears to have become easier in the light of recent developments in the field of digital mapping. For this reason, I will present at a later stage how certain tools allow the creation of custom-made web-maps, using as a case study my research on the historical live music scene of Milan.
The paper is divided into five sections. In the first one I will describe the advantages and risks inherent in the application of spatial visualization techniques to music research; in the second, I will introduce the concept of deep mapping as a possible solution to the contradictions underlying music mapping; in the third, I will present the Leaflet for R package as an open-source, sustainable and accessible environment. Finally, the Milanese music scene of the economic boom (1958–1962) will be brought into play: it will be a test bed for the theories and tools previously proposed and the object of a multimedia mapping process that combines quantitative and qualitative approaches.
Flattening Practices: Risks and Potential of Music Mapping
Every map, to be effective, needs to lie. At the core of any type of visual representation there is a process of selection that necessarily distorts reality by offering an incomplete view:
Not only is it easy to lie with maps, it’s essential. To portray meaningful relationships for a complex, three-dimensional world on a flat sheet of paper or a video screen, a map must distort reality … To avoid hiding critical information in a fog of detail, the map must offer a selective, incomplete view of reality. [6]
The idea that loss of information is inherent to the process of abstraction is also one of the foundations of what was defined by Franco Moretti as “distant reading.” [7] At the basis of his approach there is an awareness, we could say relativistic, of how the observation point always influences what is observable. The traditional analysis of a single literary text precludes the emergence of patterns observable only on a large scale; vice versa, the analysis of a large number of objects, made possible by datafication and algorithms, allows us to identify previously invisible trends to the detriment of the comprehension of the individual text.
For this reason, geodata visualization techniques seem to hold the key to what has been the main objective of urban music research since its inception: to capture the richness of the musical life of an entire city. At the beginning of the 1980s, way before the introduction of GIS in music studies, the temporal coincidence of a series of works dedicated to late-medieval or early modern cities led to the definition of “urban musicology,” [8] meant to designate what was perceived as a new research procedure. As argued by Carter, however, these seminal writings also shared a gap between the ambitious methodological premises and the actual results. On the one hand, they manifested the desire for a holistic representation of the music practices of a city, capable of setting “an uncertain, largely self-referential discipline—such as music historiography—on a secure enough footing to enable it to speak to the broader worlds of political, economic, social and cultural history.” [9] On the other hand, this perspective often translated into linear and verbal historical narratives, in which the anchoring to the spatial dimension remained in the background.
Visual mapping, thanks to the ability to simultaneously represent a plurality of elements and relations within geographical space, offers instead the means for a global investigation. This is the case, for example, of the Mapping Musical Life project, [10] which exploits the potential of GIS systems to reconstruct the music practices taking place in six different Italian cities between 1866 and 1882. Through the geolocation of news and advertisements contained in a corpus of newspapers, the symbiotic relationship between urban space and music becomes tangible, allowing for new historiographical narratives. The clustered visualization of places and events within a series of historical maps, which can be activated in synergy with a set of filters and a time slider, brings to light the stratification of the musical life of the time, beyond the main institutions of each city.
Although with different purposes, the Live Music Mapping Project adopts a similar perspective distancing, with the aim of creating a homogeneous data set for the comparison of numerous contemporary urban live music ecosystems. [11] The peculiarity of the interactive maps developed by the project is that they are capable of dynamically showing different music venues based on type, capacity, opening and closing year. In combination with this functionality, it is then possible to activate time-based choropleth layers in which the coloring of certain areas within the city corresponds to a quantitative value, such as the average price of properties. [12] In this way it becomes possible to demonstrate how the spatial concentration of live music venues systematically precedes the increase in prices and sales of houses, one of the most evident traits of urban gentrification processes.
According to these examples, it would be somehow contradictory to critique maps based on the very elements that make them useful. Visual abstraction, namely the transformation of an event or a place into a graphical symbol placed on a bi-dimensional representation of space, is a necessary “lie” for projects that aspire to investigate hundreds of music performances spanning multiple decades and involving several urban centers. At the same time, it is crucial to be careful of which lies we allow ourselves to tell when we use maps for research purposes. As Mark Monmonier argues, it is quite easy to slip from what he calls “white lies” to more “serious lies.” [13] Since most map users do not know the processes that are behind map building, people tend to trust maps and map makers. As humanists we are somehow subject to the same tendency, especially when we entrust the development of maps to professionals or when we use premade tools offered by commercial companies.
In music studies, some of these “serious lies” can be related to the complexity of music practices when considered in their immanency. Georgina Born argues that any type of Euclidean and Cartesian [14] visual abstraction is unable to catch the multiplicity of the embodied experience of music in space:
At this point it is productive to bring out the implications of the relational understanding of music, sound and space … They center on three kinds of irreducible multiplicity at work in musical and sonic experience. All three depart from Euclidean and Cartesian understandings of space in/and music, all are interwoven … The first is the multiplicity of any human subject’s experience of music and sound as s/he inhabits a particular physical or virtual space … The second is the social multiplicity given by the existence in the same performance space, site or event of many (diverse, often previously unrelated) human subjects … The third foregrounds temporal mediation. [15]
What is called into question here is not only the datafication process that preludes the creation of a digital map but the very possibility of a visual representation of space. Based on Nigel Thrift’s “non-representational theory,” [16] the spatial dimension is described by Born as constantly constructed and reconstructed within a network of relationships, no longer a fixed container:
The theorisation of space in contemporary geography is remarkably consonant with the ideas presented so far. In the most general terms, for geographers today space is the focus of an epistemological revolution involving a rejection of Kantian conceptions of space as an “absolute category” in favour of the tracing of a series of “species of space” … Space is here conceived as plural, as the outcome of social and material practices, and as indivisible from time. [17]
A “plural” space in continuous transformation is incompatible with the univocal processes of geometric measurement on which cartography, digital or otherwise, is based. Behind the potential of geospatial representation of music practices could lie a new type of sonic and spatial “visualism,” with the risk of turning back to a stage prior to the valorization of auditory perception by models such as Raymond Murray Schafer’s soundscape [18] or the more recent Steven Feld’s “anthropology of the senses.” [19] An unaware use of GIS could replicate issues that are well known across music studies, a field that struggled for decades with finding a balance between the multifariousness of sound and music and their representation through notation or other graphical means.
Deep/Thick Mapping and Thin Mapping
It is interesting to note that similar assumptions underlie a particular approach to mapping which has been defined as “deep,” in opposition to the “thinness” of maps that exclusively rely on a Cartesian representation of space.
The fixity and abstraction of the cartographic frame (the map) belie the unboundedly complex, contingent and temporal spatialities of “the field.” The deep map is a utopian imaginary of space inasmuch as it strives to frame or in some way open itself up to that which is “lived.” By contrast, the thin map … is unapologetically representational. [20]
This ambition of a visual map opening itself to what is “lived” is closely linked to the possibilities offered by new mapping technologies: a digital map is not necessarily a transposition of an “analogic” one. In fact, the core concept that defines a deep map is that GIS can be hacked and transformed into hybrid representations of space that include both quantitative data, for which they were initially developed, and qualitative multimedia content. [21] The tension and the interaction between these two dimensions define the approach: deep maps allow us to “explore how digital tools and interfaces can support ambiguous, subjective, uncertain, imprecise, rich, experiential content alongside the highly structured data at which GIS systems excel.” [22]
This blended attitude towards the spatial dimension is similar to what has been defined as “thick” mapping. By admission of the authors of HyperCities: Thick Mapping in the Digital Humanities , “thickness” is a different metaphor to indicate something that, in practice, is very similar to a deep map. [23] It is interesting to report why and when the concept of thick mapping originated because we could safely reemploy the same words to describe the emergence of the “depth” imagery, which spread in the same years:
Until recently, mapping in the humanities was deeply bifurcated between what might be called, on the one hand, a “quantitative” approach using data analysis and visualization techniques adopted from the field of Geographic Information Systems (GIS, for short), and, on the other, what might be called “metaphorical mapping,” variously articulated in cultural studies through theorizations of space and place, critiques of spatial systems, and critical cartography studies […]. Over the past couple of years, blended approaches have started to emerge in the digital humanities … without uncritically embracing or cavalierly dismissing GIS. [24]
Ten years after, the term “deep map” appears to have had a greater diffusion—a comprehensible and practical simplification given the overlap between the two definitions since their inception—which is the reason why I have given to it my preference here. This does not mean, however, that the interests and needs that initially gave rise to both definitions have weakened, quite the opposite. This is proved by the recent publication of the volume Making Deep Maps: Foundations, Approaches, and Methods, where Bodenhamer once again returns to the definition of deep map. [25]
Compared to his latest formulation, [26] we find here an interpretation that is even more open to different applications and is underpinned by the intention of retrospectively strengthening a research tradition. To achieve this, a gradual categorization of increasing complexity is employed for which a deep map may or may not use all its features without however being excluded from the definition. To understand the level of inclusivity we can refer to this minimal description: “deep maps are fluid cartographic representations that reveal the complex, contingent, and dynamic context of events within and across time and space.” [27]
At the same time, the historical contextualization of the approach is broadened. Bodenhamer’s definition is no longer bound to French Situationism and Heat-Moon’s work—from which the term “deep map” was derived [28] —but can be traced back to the earliest representations of space in the history of humanity. [29] The use of web based maps, exploiting multimedia hyper textuality, allows us to turn the clock back to the point where cartography was not aimed solely at measuring space but at its narration. In this fascinating view, HTML pop-up windows [30] embedding texts and images in a digital map resembles thirteenth-century mappae mundi much more than modern maps driven by colonial conquest. [31]
At a time when music studies face similar methodological issues in the approach to GIS, deep mapping presents itself as an established methodology, with its own tradition of research and a clear theoretical formulation. It now remains to understand how to concretely enter the horizon opened by digital mapping without delegating most of its development to specialists or pre-established commercial platforms. It doesn’t matter how “deep” a map is: it can never ignore the consideration of its inevitable incompleteness and temporariness. Therefore, the invitation to be aware of its “lies” remains valid.
Leaflet for R: Multimedia Web Apps for Humanists
The fact that musicology has entered the Digital Humanities “big tent” later than its peer and cognate disciplines [32] ensures that it can resort to open-source mapping tools that are well-oiled and accessible to begin with.
This means, for example, being able to contain problems such as those encountered by Cohen in her experimental mapping of the music scene of Liverpool. In her case, the dependence on specialized programmers caused difficulties in the interaction within the research group and made it impossible to achieve all the objectives. [33] Broader accessibility reduces the reliance on commercial platforms which, in addition to offering their services for a periodic fee, can be subject to sudden modifications. This is the case of Carto, previously known as CartoDB, cited by Bodenhamer [34] among the GIS environments with a more “qualitative” orientation: by May 1st, 2022, the software made a definitive transition to a new platform, called Carto3. These updates are quite common in the sector and are often an obstacle to the interoperability and longevity of humanistic research projects: at this moment the previous version of the Carto is no longer accessible, meaning that all the visualizations created before the update are not replicable. While the company affirms that it will maintain the cloud support for all the web-maps developed using the old platform—so that they will be still accessible by the users—there is no guarantee that it will be the same in the future.
By contrast, consider a tool like Leaflet. Leaflet is an open-source JavaScript [35] library used for the creation of web mapping applications: it was developed by Volodymyr Agafonkin and first released in 2011. Its strengths are compatibility, performance and accessibility (the library weighs only 42 KB and has no external dependencies). It also supports HTML markers and pop-up windows, which can easily incorporate external links as well as images, video and audio players. This means that interactive maps built with Leaflet can be hypertextual, potentially functioning as a spatial access point to multimedia digital archives. While most of these goals are reachable also by a few commercial web-mapping tools, Leaflet is totally open-source. An application developed with this library can be freely published and stored without depending on a proprietary cloud service, like in the case of Carto. Its code can be reused indefinitely and made available to other researchers who can then adapt it to their own needs. This aspect is not secondary, for it allows compliance with the FAIR standard (Findability, Accessibility, Interoperability, Reusability) [36] not only with regards to the dissemination of the data collected during the research, but also the visualizations themselves.
Given its features, then, Leaflet appears to be a perfect candidate for creating deep maps: it supports the technology required to overlay qualitative and experiential content onto quantitative geographic data. The only potential obstacle that could prevent its direct use by a humanist is that it requires knowledge of the JavaScript programming language, but this is where one last digital mapping environment enters the discussion.
In 2015 the first R package for the creation of Leaflet digital maps was released. [37] R is an open-source language for statistical computing and graphics, [38] and it’s broadly known in the academic world for offering the possibility to create publication-quality graphs to non-professional programmers. In fact, the basics of its syntax are much more accessible than the knowledge required, for example, to build an interactive web-map directly from JavaScript. For this reason, the Leaflet for R package features most of the advantages of working with Leaflet without requiring a formal training in its native language, offering to humanists a chance to design custom geographical visualizations.
Historical Live Music in Milan: Digital Maps as Memory Catalyzers
Let me now introduce an example taken from my own experience in working with Leaflet for R. In particular, I wish to demonstrate how the flexibility and the accessibility of this combination of open-source software allowed me to create a circular workflow between quantitative and qualitative tools. My research focus is the relationship between space and music in the city of Milan during the years of the first economic boom (1958–1962). To examine this crucial period in the music history of the city, I applied the methodological principles of deep mapping, trying to adapt them to the specificity of the topic. On the quantitative front, I have collected data about 8288 musical performances held in Milan from 1958 to 1962. [39] The historical sources used to build this data set, which includes information relating to performers, repertoires, venues, and musical genres, were two newspapers: Il Giorno, as the primary one, and Il Corriere della Sera. In both cases detailed information relating to musical events in Milan at the time is reported on a daily basis.
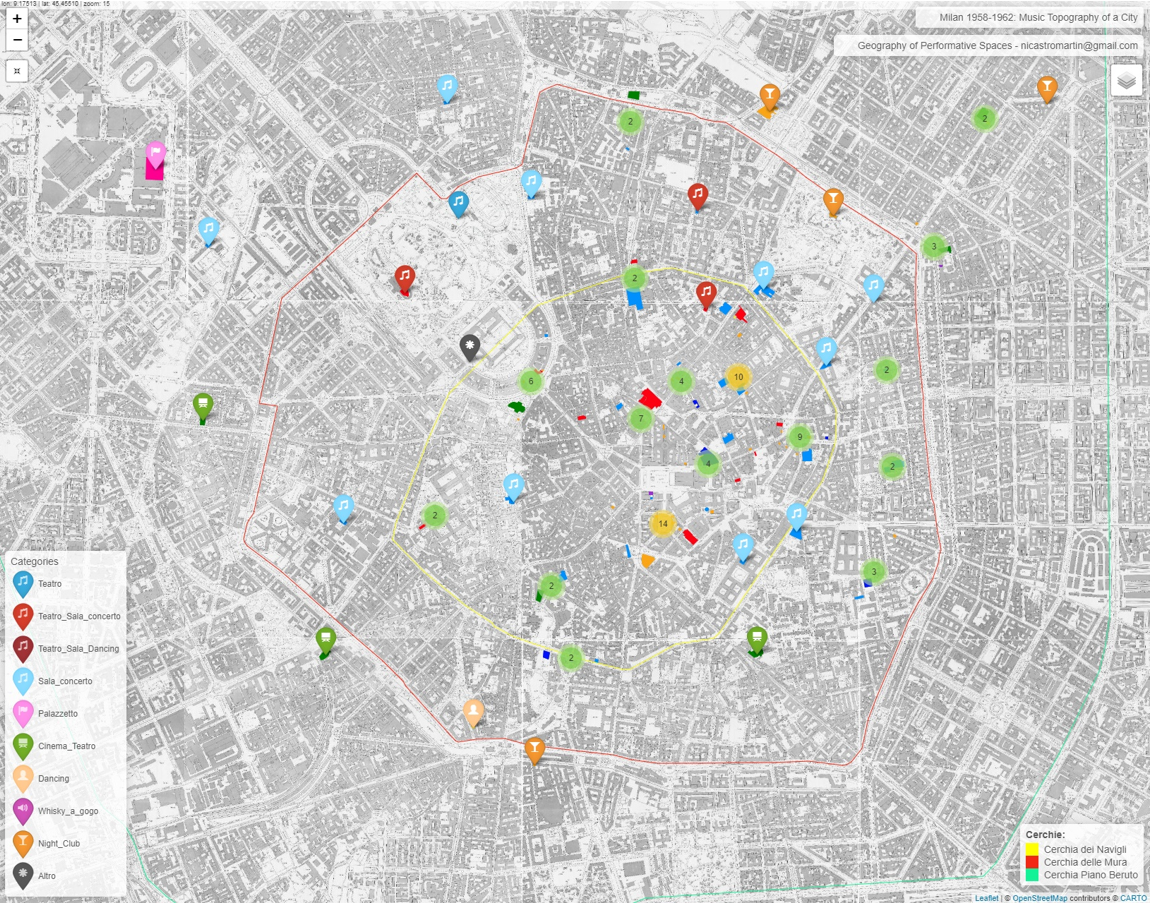
Fig. 1 – “Geography of Performative Spaces.” Interactive version here.
Starting from this main data set, I then proceeded to create various interactive Leaflet maps in R. Among these, the visualization called “Geography of Performative Spaces” [40] constituted the fundamental skeleton from which I have built all the subsequent declinations. [41] In this map I have geolocated the spaces which, according to the newspapers, hosted at least one musical event in the years considered. I therefore indicated their location in the urban space both through point markers and two-dimensional polygons that symbolize their physical extension. In both cases, I used colors and icons to reflect the diversity within the sample as represented in the categorization system used within the newspapers (Figure 1).
The spatial diffusion of each of these venues subsets is observable through the activation of different layers, selectable through a pop-up menu located at the top right-hand corner. The selector also allows the activation of two other quantitative visualizations: the incidence of musical events by location and the capacity of each space, created using circular markers of different colors and sizes. Finally, all these graphic representations are overlaid on a historical map that portrays the city in 1965 ca., made available via WMS by the Municipality of Milan. [42]
Thanks to these features it was already possible to demonstrate several working hypotheses, including the close relationship between the spatial hierarchies of the city and the diffusion of different types of venues and practices. [43] In compliance with the principles of deep mapping, however, this digital map was not intended as a destination, but rather a starting point for qualitative and narrative-based historical analysis. [44]
The second stage of the project, accordingly, revolved around eight field interviews with musicians active in the music scene of the time. [45] These sessions involved the use of both a laptop and interactive maps, equipped, if the data allowed it, with an additional layer representing the music performances in which the interviewee had taken part.
The question that introduced the visualization explicitly invited the witnesses to critically observe the data represented, welcoming them to comment on whether it reflected their memory of the events. The reactions, recorded on camera, were of great interest and, at least initially, partially unexpected. Several witnesses were surprised to see their artistic activity represented on a digital map. The Leaflet application, which the interviewees were not aware of before the session, therefore played an important role in destabilizing the self-narration of some of these musicians, otherwise well accustomed, given the professional level of their careers, to speaking of their artistic activities.
In several cases, the interviewees did not remember the events represented on the map. Natale Massara, at the time sax player for Adriano Celentano’s Ribelli, [46] did not recall having taken part in a show named “Music Juke Box Parade” held on March 28, 1960, at Teatro Carcano. [47] He was made suspicious by the fact that on that occasion the Ribelli were accompanying a singer called Sauro, with whom Massara was sure he had never played. At that point, taking advantage of the multimedia nature of the map, I retrieved the historical source that testified the event via a link present in the application. This, in turn, triggered a rather articulated process of memory reconstruction on the part of the interviewee.
Seeing the image taken from the newspaper spurred Massara to reflect on the temporal juncture of the event: in February 1960 Celentano could not perform due to military service but, due to the band’s need to remain active, numerous concerts were given with different front singers. Given Celentano’s fame, the group was still announced as “I Ribelli di A. Celentano” for promotional purposes.
The use of personalized maps stimulated the witnesses to break through the ceiling of their self-narration whose unexpected cracks made it possible for other memories to emerge. Returning to Massara’s example, the musician invited me to search the map for places that to him were important. He was worried that these might be missing. Thanks to the interactive aspects of the application, it was possible to follow the ebb and flow of his narrations, using the historical map of Milan as a constant visual support that helped the witness place his memories in the urban space. In some cases, geolocation has contributed to giving shape to a place the memory of which had faded to the point of no longer having a name. While consulting the map, Massara felt it was important to mention the place where he first met Lucio Battisti (with whom he would collaborate in the years to come). Thanks to my ability to move within the visualization, I followed his attempt at orientation until we managed to identify the area in which the unnamed venue was located. Something similar happened with Lino Patruno, [48] who wanted to identify on the map the point where a private theatre, with an unspecified name, was located: the venue where he met the jazz pianist Romano Mussolini for the first time.
The results obtained from the experimental use of interactive maps during the conduction of field interviews recall Cohen’s experience with musicians drawing maps of their own experience of urban space. The interactive nature of the visualization appears to have allowed the interviewees to trace their own trajectories, not unlike the mechanisms triggered by Cohen’s ethnographic method. In both cases the maps proved to be particularly effective “memory machines”:
Yet, whilst drawing their maps, musicians talked to us about their music-making activities and experiences and some of the sites involved. In doing so, they showed how at particular moments, and within particular circumstances, the act of mapping can prompt memories and stories of music and place; hence, in the words of Marc Augé, a map can be “a memory machine.” Drawing the maps helped musicians to express musical experience and knowledge in spatial terms, and provided them with a means of connecting music to memories of material urban environments and associated identities, emotions, and relationships. [49]
The test case of Milan provides a further example of the special status of digital maps and their possibility of overcoming the “non-dialectical” [50] nature of Cartesian spatial visualizations. The experiential, exploratory, and interactive components of these applications can amplify their interlocutory dimension, revealing a potential as innovative tools for the conduction of field research.
Deep Map as a Product: Feedback-Based Multimedia.
The use of a digital map to stimulate stories that convey the multiple facets of a lived space can be already placed in the constellation of practices that has been defined as deep mapping. As argued by its theorists, however, deep mapping can be understood as “a platform, a process and a product.” [51] In the case of my research dedicated to Milan, the materials produced during the interviews were translated into a specific web-map.
The “Music Memories Map” (Figure 2) [52] is characterized by a layer that, taking advantage of the HTML support offered by Leaflet, allows the user to access video players directly within the application. This means that by clicking on specially prepared markers it is possible to view some audio-video clips taken from the interviews. These clips were cut using a video editor [53] whenever a witness located a memory in a specific place belonging to the urban fabric of Milan. These markers were then geolocated according to the coordinates deductible from the musicians’ narration, which, as previously reported, most often emerged from the exploration of the map during the interviews. The “Musical Memories Map” is therefore based on a feedback, circular process: the tool used to recall the memories becomes, in a second phase, their collector and access point.
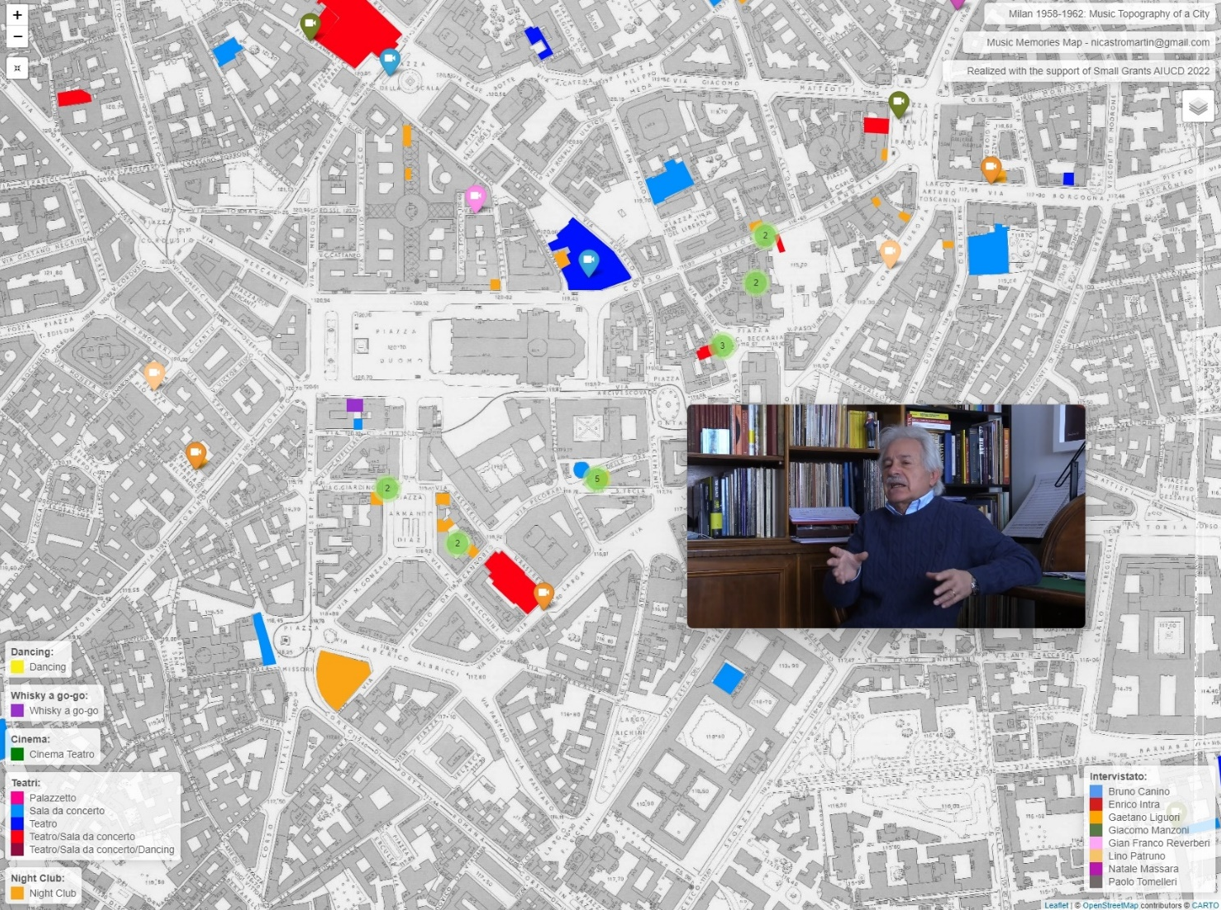
Fig. 2 – “Music Memories Map.” Interactive version here.
Thanks to the inclusion of the interviews in a dedicated layer, it is also possible to consult them in combination with the pre-existing quantitative layers. A first element of interest concerns the partial non-coincidence between the places included in the newspapers and those cited by the witnesses. This is the case, for example, of the two nameless venues mentioned by Massara and Patruno. In these circumstances my intention was to underline the heterogeneous nature of the sources, not integrating the two layers and using different symbols. In the “Music Memories Map” the venues mentioned in the newspapers are represented only through polygons, while the memories are indicated using icon markers. In this way the user can immediately understand which spaces have been reported by both newspapers and musicians and which only by one or the other.
This makes it possible to highlight that neither point of observation affords a complete picture and underlines a key aspect of my methodology, namely the need for a critical and relativistic approach to GIS (and to any data analysis tool in general). In the specific case of my research on Milan, the asymmetry of the quantitative data set is evident and is rooted in specific circumstances. Out of 8288 musical events reported by newspapers, 7741 (93.40%) are attributed to the “theatre” category. The weight of this overwhelming majority is especially noteworthy given that “theatres” constitute only just over half of the sample of the venues (67 out of 122, 54.92%). By activating the layer relative to the number of musical events attributed to each venue (Figure 3), the quantitative imbalance towards the “theatres” (in red and dark blue) becomes obvious; among them, signaled by wider and darker circles, stand out the Teatro Lirico (877 events), Teatro Odeon (838), Teatro Nuovo (805), Teatro alla Scala (803) and Piccolo Teatro (766).
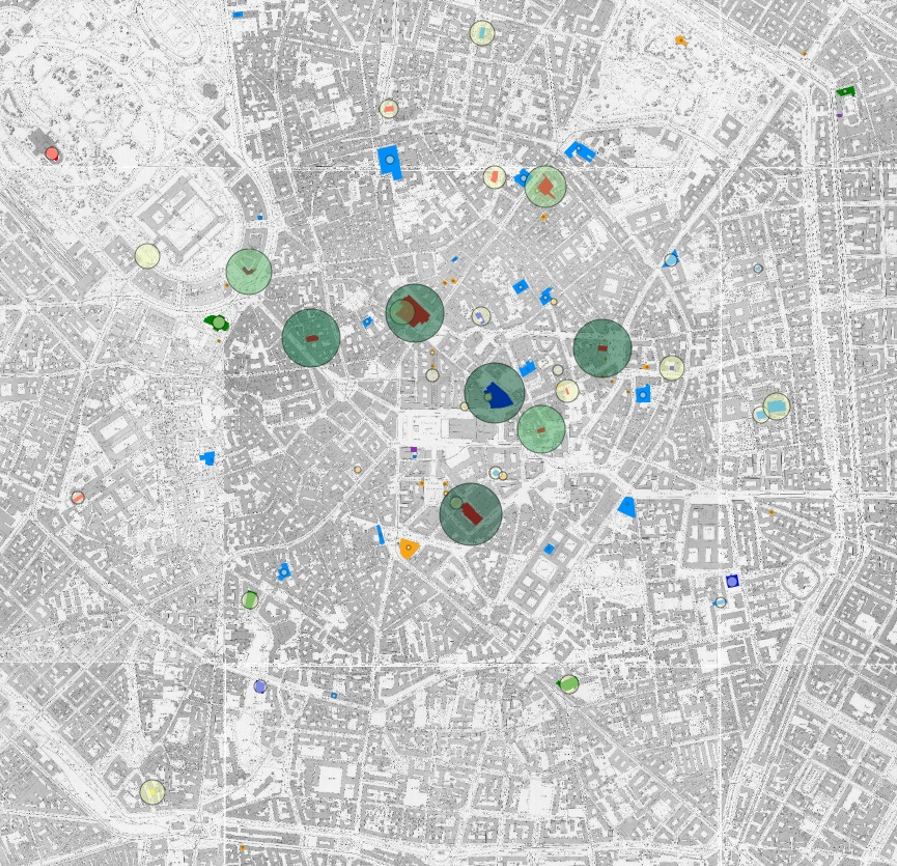
Fig. 3 – “Music Memories Map.” Interactive version here.
This does not mean that in the remaining categories (“night club,” “dancing,” and “whisky a go-go”) music performances were occasional—quite the opposite, in fact. When asked about the frequency of events hosted in “night clubs,” clarinetist Paolo Tomelleri [54] talked about almost continuous performances throughout the night, every day of the week and without seasonal breaks. [55] Multiplying this general indication with the number of “night clubs” identified (40) the performance volume attributable to them would be greater than 70.000, therefore exceeding the extension of the original data set by several dozen times! With an average hypothetical value of 1750 music performances across the five years span, each “night club” would easily beat the record held by Teatro Lirico with 877 events.
The significance of the discrepancy is obvious and provides a measure of the level of caution needed in working with data analysis and visualization. At the same time, this extrapolation pushes us to ask why the disparity in treatment between “theatres” and “night” within the sources is so extreme and precise. By delving into the distinctive characteristics of the musical practices hosted in these two types of venues it is possible to put forward an answer and simultaneously also demonstrate that what is missing from a data set is sometimes just as interesting as what the data set covers. If placed in the right light, in fact, data asymmetries are not a simple deficit, but can be revealing of crucial aspects of the sources and the context analyzed.
At first glance, the category defined in the newspapers as “theatres” includes an extremely heterogeneous range of places: opera houses, concert halls, sports halls, cinemas, cultural clubs, universities, historical palaces, museums, churches, and art galleries. The definition, rather than referring to a precise spatial typology, then, seems to point to a specific performative modality, namely that of the “live concert,” a modality that cuts across a wide range of practices. Upon detailed examination, the “theatres” type shows characteristics similar to what Frith describes as “concert hall”:
The concert hall, [is] a building designed for musical events—concerts—dating from 18th century … Built into this structure are a number of assumptions: the commercial basis of the musical event—i.e. people pay money for tickets to attend a specific occasion (the concert as a commodity) … The ticket takes on—materializes—the commodity value of the musical event itself (which is transitory), so the ticket may be more and more valuable before the concert (see the current black market or ticket re-sale issue) but is worthless after it. [56]
The performances in the Milanese “theatres” are characterized by a clear indication of the performers and their repertoire, by a limited duration in time (on average two hours) and by a non-recursive and extraordinary nature (except for a limited number of replicas). All these features strengthen the interpretation that the category in question revolves around the commercial nature of the musical performance, which constitutes the focus of the audience and a special kind of experience accessible through the purchase of a ticket.
On the contrary, “night club” performances are not the object of a direct purchase; rather, the only active transaction concerns the consumption of food and (mostly alcoholic) drinks. This resonates in the distinctive features of the “night clubs”: the audience is seated around tables and does not necessarily look at the musicians; the performance is continuous and extends throughout the opening hours; [57] the repertoire performed, in a manner not dissimilar to what happens in contemporary DJing, follows a general outline that is susceptible to modifications made on the spot and it’s partially different each night; [58] finally, the performance is not a one-off event because the musicians, when hired by a club, perform there for weeks (if not months) at a time. Considering all this, the asymmetry in the coverage offered by the newspapers is clear: their practical purpose is to report day by day the precise space-time coordinates of musical events limited in time and purchasable through a ticket. In fact, on the rare occasions when advertisements relating to “night clubs” appear in newspapers only the names of the musicians are indicated, without any mention of day or time.
Only field research has made it possible to delve into aspects of the subject which would otherwise remain hidden by the data. This practical example allows us to reiterate the importance of a blended and hybrid approach such as the one offered by deep mapping: embracing the diversity of sources and enhancing their potential complementarity within digital visualizations allows us to build a picture that is more faithful to the complexity of the phenomena investigated.
In this sense, the possibility of creating interactive multimedia maps is crucial. Let’s now simultaneously activate the layer that reports the location of the interviewees’ memories and a heat map that depicts the concentration of the venues cited in the newspapers (Figure 4).
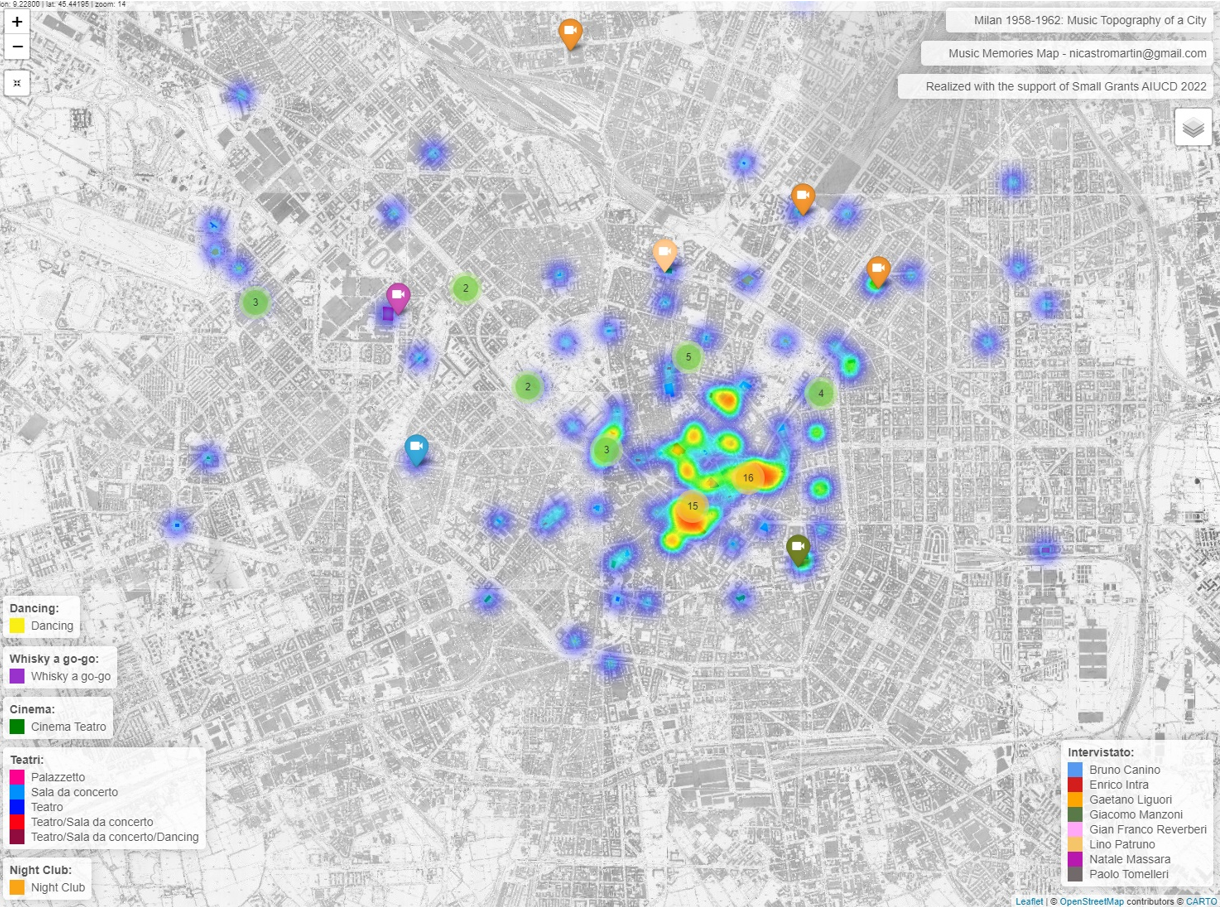
Fig. 4 – “Music Memories Map.” Interactive version here.
In this case quantitative and qualitative sources are in agreement: the greatest number of memories (35) is to be found in the eastern half of the innermost circle of the city, equally distributed (15, 16) across the two areas where most of the venues are concentrated. At a higher level of granularity, however, it is possible to observe that as many as five out of eight witnesses placed their memories at the Santa Tecla “night club,” which holds the record for the number of stories dedicated to it (Figure 5).
This element is particularly interesting if observed against the layer that represents the number of events for each location: the data set built from newspapers attributes only 16 performances to the Santa Tecla over a five-year period. In the context of the asymmetries considered above, this comparison once again demonstrates the importance of an approach to digital mapping capable of enhancing the complementarity between different sources: without the attempt to open the map to the perception of the musicians, the importance of places like Santa Tecla might have gone unnoticed.
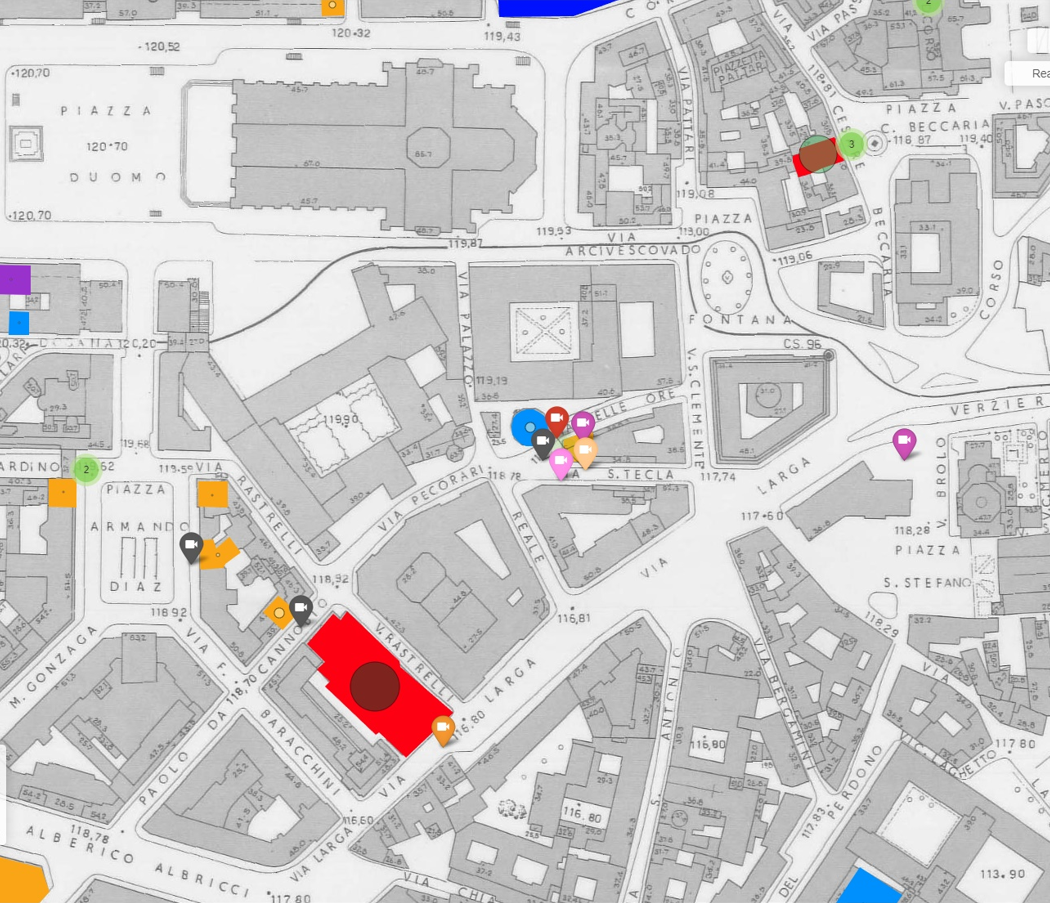
Fig. 5 – “Music Memories Map.” Interactive version here.
Finally, thanks to the inclusion of the video players, it is possible to explore the personal stories that are woven into the history of the venue, as recalled by the witnesses who experienced it. Each of them portrays a slightly different space, highlighting the multiplicity of the spatial dimension when considered from a subjective perspective. [59] For Lino Patruno Santa Tecla was a “school,” for Gian Franco Reverberi it was the “number one venue in Milan,” with unique characteristics compared to all the other “night clubs” in the city, for Paolo Tomelleri a Parisian-style “cave” whereas for Natale Massara a “jazz club” or, more simply, a “meeting place where music was made.”
This partial exam of the case study of Milan demonstrates how deep mapping can constitute a comprehensive methodology for the study of music practices: the tensions between an embodied and a quantitative approach to the spatial dimension appear to be a fertile ground for solutions that can be beneficial in both directions. The circular workflow here proposed, facilitated by the use of open-source tools, is also just one between many. In fact, the modularity of web-based technologies allows us to create different paths through which to explore the relation between space and music.
My research experience on the music scene in Milan in the years 1958–1962 highlights the extent of the “lies” that could be produced by an uncritical use of digital mapping technologies. The severity of said lies is proportional to the effectiveness with which GIS tools can analyze complex spatial phenomena and to the credibility attributed to this type of representations. It is difficult for a user to critically observe a map of any kind without in-depth knowledge of the object represented; this tendency is even more pronounced in the case of highly efficient interactive applications, equipped with immediate graphical interfaces, hypertext links, pop-up windows, and multimedia players. A first conclusion therefore concerns the proportionality between the technological power of a given tool and the methodological caution with which it must be used, starting from the awareness that each set of data (as a translation of a specific source) always offers a partial vision of the object it aims to describe. In this respect, deep mapping is certainly a step in the right direction, because it favors the fusion of heterogeneous sources and techniques, placing a strong emphasis on the interlocutory and provisional nature of any type of representation. Given the complex, multilayered nature of music practices, this blended approach seems to offer the right framework for the development of digital music mapping. Deploying GIS as a multimedia and experiential collector rather than just a measurement tool is crucial for a discipline that is historically aware of the risks of excessively depending on visual formalization.
The creation of applications with Leaflet for R opens new possibilities of integration between data analysis technologies and research methodologies in the humanities. Compared to premade platforms, Leaflet gives the opportunity to design interactive maps in detail, customizing them based on the specificity of the research topic. Instead of video players, for example, it would be possible to integrate within the application audio sources of any kind, locating them in geographical space; or to exploit Leaflet’s touch screen support to create an exhibition where the public can explore interactive maps through panels and add on the spot new markers with a simple touch; [60] or, again, combine two-dimensional interactivity with virtual reality, allowing the user to experience the interiors of the places represented on a map.
It is thanks to this kind of flexibility that I was able to create the circular workflow presented here, which combined historical sources, field research and data visualization tools. Finally, it is also important to remember how the adaptability and interoperability of an open-source work environment like R go far beyond an individual research project: each module that makes up the applications shown here is derived from previous works and can be reused in the most diverse contexts, each time contributing to the free circulation of software across the humanities and beyond. [61]
[1] Sara Cohen, “Live Music and Urban Landscape: Mapping the Beat in Liverpool,” Social Semiotics 22 (2012): 587–603.
[2] “MML – Mapping Musical Life,” accessed May 17, 2024.
[3] Adam Behr, Craig Hamilton, Patrycja Rozbicka, “Birmingham and the (International) Business of Live Music in Times of COVID-19,” Journal of World Popular Music 9, no. 1–2 (2022): 31–48. “Live Music Mapping Project,” accessed May 17, 2024.
[4] “Especially since the 1990s, with the advent of the World Wide Web, digital humanities has broadened its reach, yet it has remained in touch with the goals that have animated it from the outset: using information technology to illuminate the human record, and bringing an understanding of the human record to bear on the development and use of information technology.” Susan Schreibman, Ray Siemens, and John Unsworth, “The Digital Humanities and Humanities Computing: An Introduction,” in A Companion to Digital Humanities, ed. Susan Schreibman, Ray Siemens, and John Unsworth (Malden: Blackwell Publishing, 2004), xxiii.
[5] “Although the breadth of fields covered is wide, what is revealed is how computing has cut across disciplines to provide not only tools, but methodological focal points … Many disciplines have gone beyond simply wishing to preserve these artifacts, what we might now call early forms of data management, to re-represent and manipulate them to reveal properties and traits not evident when the artifact was in its native form.” Schreibman, Siemens, and Unsworth, xxiii–xxiv.
[6] Mark Monmonier, How to Lie with Maps (Chicago: Chicago University Press, 1991), 1.
[7] Franco Moretti, Distant Reading (London: Verso, 2013).
[8] Anthony Newcomb, The Madrigal at Ferrara, 1579–1597 (Princeton: Princeton University Press, 1980); Iain Fenlon, Music and Patronage in Sixteenth-Century Mantua (Cambridge: Cambridge University Press, 1982); Lewis Lockwood, Music in Renaissance Ferrara, 1400–1505: The Creation of a Musical Center in the Fifteenth Century (Oxford: Oxford University Press, 1984); Allan W. Atlas, Music at the Aragonese court of Naples (Cambridge: Cambridge University Press, 1985); Reinhard Strohm, Music in Late Medieval Bruges (Oxford: Clarendon Press, 1985).
[9] Tim Carter, “The Sound of Silence: Models for an Urban Musicology,” Urban History 29, no. 1 (2002): 9.
[10] “MML – Mapping Musical Life,” accessed May 17, 2024.
[11] “Live Music Mapping Project,” accessed May 17, 2024.
[12] This feature, to the development of which I contributed personally as part of the research group, has currently only been shown during conferences, but it will soon be published on the project’s website.
[13] “Because most map users willingly tolerate white lies on maps, it’s not difficult for maps also to tell more serious lies … As with many things beyond their full understanding, they readily entrust map-making to a priesthood of technically competent designers and drafters working for government agencies and commercial firms … Map users seldom, if ever question these authorities, and they often fail to appreciate the map’s power as a tool of deliberate falsification or subtle propaganda.” Monmonier, How to Lie with Maps , 1.
[14] The definition of Euclidean space commonly describes a two- or three-dimensional representation of physical space in which the fundamental laws of geometry apply. Thanks to Cartesian coordinates it is possible then to represent the location of a point by using a pair (or a triplet, when a third dimension is present) of numbers, which represent the distances between the point and two or three perpendicular axes. Although latitude and longitude represent angular and not planar measures, the geographical coordinate system used in most maps is based on similar mathematical principles.
[15] Georgina Born, “Introduction. Music, Sound and Space: Transformations of Public and Private Experience,” in Music, Sound and Space: Transformations of Public and Private Experience, ed. Georgina Born (Cambridge: Cambridge University Press, 2013), 19.
[16] Nigel Thrift, Non-Representational Theory: Space, Politics, Affect (London: Routledge, 2008).
[17] Born, “Introduction,” 20.
[18] R. Murray Schafer, The Soundscape: Our Sonic Environment and the Tuning of The World (Rochester: Destiny Books, 1994).
[19] Steven Feld and Donald Brenneis, “Doing Anthropology in Sound,” American Ethnologist 31, no. 4 (2004): 461–74.
[20] Les Roberts, “Preface: Deep Mapping and Spatial Anthropology,” Deep Mapping, ed. Les Roberts (Basel: MDPI, 2016), xii.
[21] “Traditional GIS with its emphasis on precise measurement and spatial models is not the means for constructing a deep map. But it is part of the solution, especially when linked to recent advances in spatial multimedia, GIS-enabled web services, cyber geography, and virtual reality, among other tools … Collectively, these technologies allow us to probe the situated knowledge that resides in dynamic and contested memories and to understand the affective or emotional geographies of space and place. They have the potential, in brief, to revolutionize the role of place in the humanities by moving beyond the two-dimensional map.” David J. Bodenhamer, “The Varieties of Deep Maps,” in Making Deep Maps: Foundations, Approaches, and Methods , ed. David J. Bodenhamer, John Corrigan, and Trevor M. Harris (Abingdon: Routledge, 2022), 4.
[22] Mia Ridge, Don Lafreniere, and Scott Nesbit, “Creating Deep Maps and Spatial Narratives through Design,” International Journal of Humanities and Arts Computing 7, no. 1–2 (2013): 176.
[23] “Instead of positing another depth model or yet another celebration of postmodern hyperspace, the HyperCities project strives for ‘thickness.’ Thickness means extensibility and polyvocality: diachronic and synchronic, temporally layered, and polyvalent ways of authoring, knowing, and making meaning.” Todd Presner, David Shepard, and Yoh Kawano, HyperCities: Thick Mapping in the Digital Humanities (Cambridge, MA: Harvard University Press, 2014), 18. “In practice, there is much convergence between the notion of ‘thick mapping’ that we are describing here and Bodenhamer’s ‘deep maps’ that embody humanistic approaches to spatio-temporal data marked by ambiguity, uncertainty, contingency, and incompleteness.” Presner, Shepard, and Kawano, 204.
[24] Presner, Shepard, and Kawano, 49.
[25] Bodenhamer, “The Varieties of Deep Maps.” See also David J. Bodenhamer, “The Potential of Spatial Humanities,” in The Spatial Humanities: GIS and the Future of Humanities Scholarship , ed. David J. Bodenhamer, John Corrigan, and Trevor M. Harris (Bloomington: Indiana University Press, 2010), 14–30; David J. Bodenhamer, “Narrating Space and Place” in Deep Maps and Spatial Narratives , ed. David J. Bodenhamer, John Corrigan, and Trevor M. Harris (Bloomington: Indiana University Press, 2015), 7–27.
[26] “A deep map is a finely detailed, multimedia depiction of a place and the people, animals, and objects that exist within it and are thus inseparable from the contours and rhythms of everyday life. Deep maps are not confined to the tangible or material, but include the discursive and ideological dimensions of place, the dreams, hopes, and fears of residents—they are, in short, positioned between matter and meaning.” David J. Bodenhamer, John Corrigan, and Trevor M. Harris, “Introduction: Deep Maps and the Spatial Humanities,” in Deep Maps and Spatial Narratives, ed. David J. Bodenhamer, John Corrigan, and Trevor M. Harris (Bloomington: Indiana University Press, 2015), 3.
[27] Bodenhamer, “The Varieties of Deep Maps,” 6–7.
[28] William Least Heat-Moon, PrairyErth (a Deep Map) (Boston: Houghton Mifflin, 1991).
[29] “The impulse toward deep mapping—linking geographic and cultural representations of a place—began when mankind first created maps. One of the earliest known examples, the Çatalhöyük Map from Turkey (ca. 6200 BCE), displays an arrangement of differently sized dwellings, possibly representing social status, and a far out-of-position volcano that had both religious and economic significance for the inhabitants.” Bodenhamer, “The Varieties of Deep Maps,” 1.
[30] HTML, an acronym for HyperText Markup Language, is a textual markup language used for creating multimedia documents on the web. Together with CSS and JavaScript it is one of the central technologies of the World Wide Web. In a web-mapping context, HTML is mostly used to manage the creation of pop-up windows that are activated by the user through interaction with the graphic objects present in the map.
[31] “Consider the thirteenth-century Ebstorf Map, the largest example from a genre known as mappae mundi. The map, an idealized depiction of the known world sewn from thirty goatskins, is a visual encyclopedia of knowledge about the world, with over 2,000 drawings and explanatory texts that combine geography, religion, science, and folklore. In it the earth is an event-filled and storied place. It was a deep map.” Bodenhamer, 1.
[32] Melissa Terras, “Peering Inside the Big Tent: Digital Humanities and the Crisis of Inclusion,” Melissa Terras: Adventures in Digital Humanities (blog), July 26, 2011.
[33] “For all of those involved, the pilot mapping project was an experimental initiative and not something we had ever attempted before, and putting it all together proved to be a challenging and often frustrating process. Whilst there were no fixed expectations as to how the maps might turn out, it was, nevertheless, important for the Popular Musicscapes project that their form and content should be shaped largely by the ethnographic research with musicians. … Because my research associate and I had not yet been trained in the use of GIS we were dependent on assistance from Civic Design students at the University of Liverpool, who had to re-interpret the data we passed on to them to make it comply with the kind of GIS training they had received. Consequently, the focus of the maps shifted towards the material sites of music-making and away from the practices and perspectives of musicians.” Cohen, “Live Music and Urban Landscape,” 589.
[34] “Web mapping platforms such as Google Maps, MapQuest, CartoDB, Palladio, and Neatline do not have the same quantitative orientation as GIS software, allowing a diversity of spatial data to be visualized.” Bodenhamer, “The Varieties of Deep Maps,” 5.
[35] One of the fundamental programming languages of the World Wide Web, first published in 1995. It is mainly used for the creation of dynamic graphical interfaces.
[36] Mark D. Wilkinson et al. “The FAIR Guiding Principles for Scientific Data Management and Stewardship,” in Scientific Data , no. 3 (2016): 160018.
[37] “Leaflet for R,” accessed May 17, 2024.
[38] “What is R?,” R Project, accessed May 17, 2024.
[39] Martin Nicastro, Milan 1958-1962: Music Topography of a City (main dataset) , Zenodo, 2023.
[40] “Geography of Performative Spaces,” accessed May 17, 2024.
[41] All the interactive versions of the geographical visualizations are accessible on a dedicated website. “Milan 1958–1962: Music Topography of a City,” accessed May 17, 2024.
[42] The Web Map Service (WMS) is a standardized protocol that allows access to georeferenced map images published over the Internet. “Open Data,” Milano Geoportale, accessed January 25, 2024.
[43] “Theatres” and “night clubs” were mostly located in the inner circle of the city, called “Cerchia dei Navigli,” while “cinema teatro,” “dancing,” and “whisky a go-go” tended to be in the more external ones. In combination with various historical sources, it was possible to prove the link between this trend and Milanese “radiocentrism,” with important implications regarding accessibility, immigration, and mass media.
[44] “How we construct these narratives will depend, in part, on the richness of our evidence and the tools at our command, but deep mapping can be an ideal storyboard for humanists.” Bodenhamer, “Narrating Space and Place,” 23.
[45] The complete list is: Gian Franco Reverberi, Lino Patruno, Natale Massara, Paolo Tomelleri, Gaetano Liguori, Bruno Canino, Giacomo Manzoni, and Enrico Intra. For an edited version of each interview and a brief biographical introduction refer to the research website. See “Milan 1958–1962: Music Topography of a City,” accessed May 17, 2024.
[46] I Ribelli was an Italian rock band, born in 1959 to be the accompaniment formation for Adriano Celentano.
[47] “Oggi a Milano,” Il Giorno, March 28, 1960, 8.
[48] Lino Patruno (1935) is a banjoist and guitarist. His main fields of activity are traditional jazz, with formations such as the Milan College Jazz Society or the Riverside Jazz Band, and cabaret with “I Gufi,” of which he is co-founder.
[49] Sara Cohen, “Bubbles, Tracks, Borders and Lines: Mapping Music and Urban Landscape,” Journal of the Royal Musical Association , no. 137 (2012): 137–8.
[50] “Although, as geographer David Harvey observes, ‘maps are typically totalizing, usually two-dimensional, Cartesian, and very undialectical devices,’ that does not, of course, mean that digital deep maps—or, rather, deep mapping practices that exploit the many possibilities and advantages offered by digital and geospatial technologies—are necessarily cut from the same Cartesian, undialectical cloth.” Roberts, “Preface,” xii–xiii.
[51] Bodenhamer, “The Varieties of Deep Maps,” 7.
[52] “Music Memories Map,” accessed May 17, 2024.
[53] Da Vinci Resolve, a professional-grade free to use video editor.
[54] Paolo Tomelleri (1938) is a jazz clarinetist, saxophonist, and bandleader. Part of various traditional jazz bands, including the Windy City Stompers, he was a member of “I Cavalieri” together with Gian Franco Reverberi, Luigi Tenco, Enzo Jannacci, and Nando De Luca.
[55] “The music performances at the night clubs were exhausting … Bruno Quirinetta, a brilliant, dynamic orchestra leader, launched the trend of playing non-stop. Non-stop meant that there shouldn't be even a second's pause between one song and another, the music was continuous. And the hours were exhausting … we played from 9.30 pm to 4 am, on Saturdays till 5 am, non-stop … I don’t think there were any days off… there was music every day and all year round.” Paolo Tomelleri, “Milan 1958–1962: Music Topography of a City,” interview by Martin Nicastro, February 2, 2022, video, 16:55.
[56] Simon Frith, “The Materialist Approach to Live Music,” Live Music Exchange (blog), July 2, 2012.
[57] “There wasn’t supposed to be any solution of continuity and many night clubs used two orchestras just for this reason; there was no recorded music, there was no broadcast music: there was the possibility of using it, but it was not in the concept of the night club.” Tomelleri, interview.
[58] “The orchestra had to know how to play well, but also how to interact with the audience. The good orchestra leader was the one who understood that the man at the table over there or the woman that accompanied him liked that song, often the last song released.” Martin Nicastro, “Astoria,” Milan 1958-1962: Music Topography of a City (videomap library), Zenodo, 2024.
[59] Martin Nicastro, “Santa Tecla,” Milan 1958-1962: Music Topography of a City (videomap library).
[60] A great example of a crowdsourced audio web-map is the Lapsed Clubber Audio Map, which creation was directed by Beate Peter. “The Lapsed Clubber Audio Map,” Manchester Digital Music Archive, accessed May 17, 2024.
[61] All the data sets and codes presented here are contained in a Github repository and published on Zenodo. Martin Nicastro, Milan_1958_1962_Music_Topography_of_a_City (v1.0.0) , Zenodo, 2023.